Portfolio
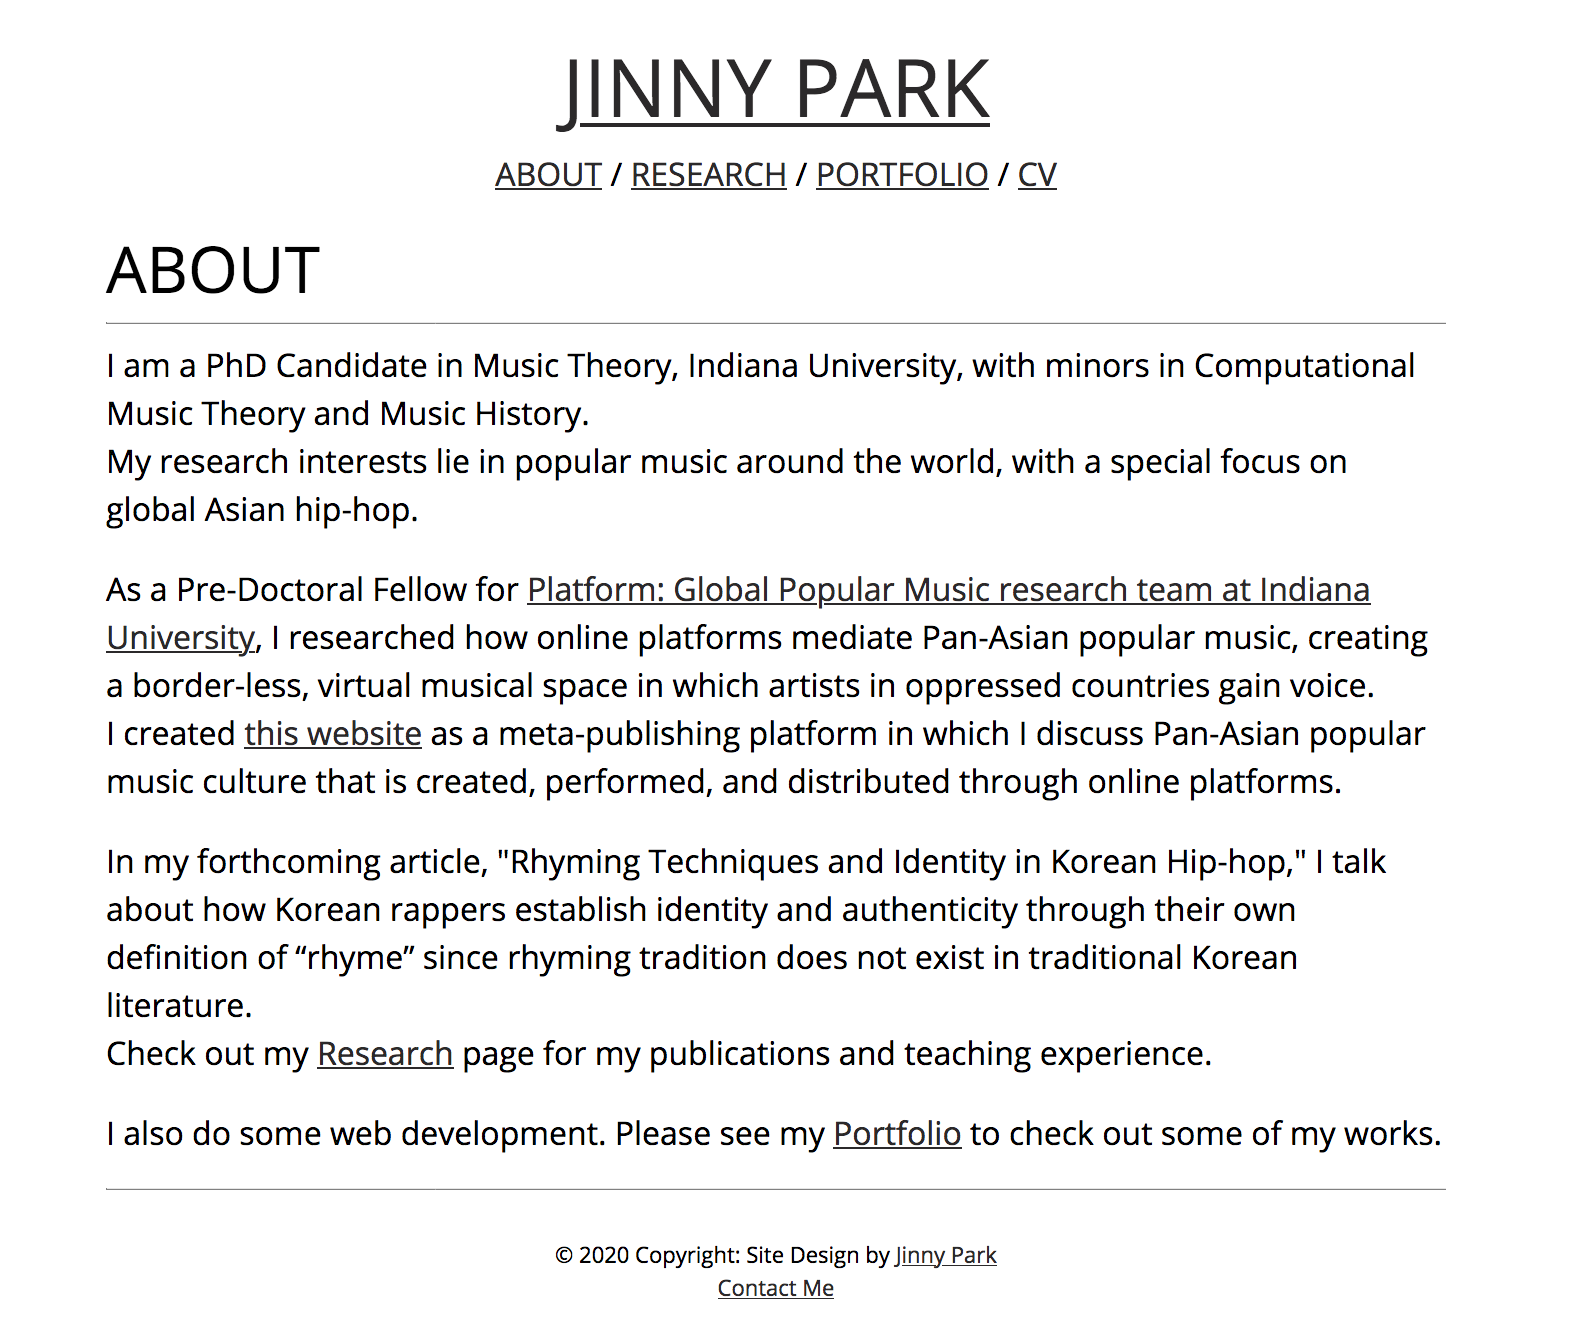
Personal Website
Data Analytics: Divvy Bike Trip Data Analysis
This Jupyter notebook shows the capstone data analysis project done as a part of the Google Data Analytics certificate program.
This analysis is based on the Divvy case study “‘Sophisticated, Clear, and Polished’: Divvy and Data Visualization” written by Kevin Hartman (found here.).
The goal of this capstone analysis was to answer the key question: “In what ways do members and casual riders use Divvy bikes differently in 2022?”
Since the Divvy bike trip data is collected monthly, this script first aggregates 12-month’s worth of Divvy bike ridership data in 2022 into a single dataframe. Data is cleaned and transformed to perform simple analysis on ride duration per weekday and ride membership type. Using ggplot, I provide easy-to-understand insights into ridership pattern for each membership type.
Click here to view.Meta Corpus Tutorial with Music21
This Jypter Notebook is a companion tutorial for analyzing meta corpus data from my dissertation, "Diatonic Chord Loops in Post-millennial Pop," with Music21.
Music21 is a Python library that allows you to parse and analyze music data of different formats (e.g., MIDI, MusicXML, humdrum, etc.). One of the data formats Music21 can read in is de Clercq & Temperley's (2011) Billboard Rock Corpus encoding format, which meta corpus data encoding system is built.
A main reason I chose music21 for working with data is because of its flexibility in reading different varieties of data formats. Once the data is parsed and loaded to music21, it can be operated and manipulated like any other music21 object, harnessing the analytical power of music21. Moreover, music21 object can be exported into desired formatting, including MIDI, PDF score in Western staff notation, and more.
In this tutorial, I introudce the module music21.romanText.clercqTemperley to read in and parse our meta corpus data.
Click here to view.
Research Blog